openHarmony 实现柱状图
【代码】openHarmony 实现柱状图。
·
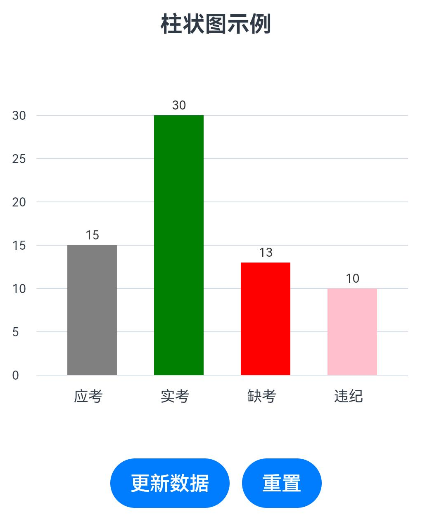
柱状图
- 效果图
BarChartPage示例代码
@Entry
@Component
struct BarChartPage {
  @State private data: number[] = [15, 30, 13, 10]
  @State private data2: string[] = ['应考', '实考', '缺考', '违纪']
  @State private colors: Color[] = [Color.Grey, Color.Green, Color.Red, Color.Pink]
  @State private gridValues: number[] = [30, 25, 20, 15, 10, 5, 0]
  private maxValue: number = 30
  private chartWidth: number = 300
  private chartHeight: number = 250
  private paddings: number = 30
  private barWidth: number = 40 //柱状图的宽度
  private barSpacing: number = 30 //柱间距
  // 创建CanvasRenderingContext2D对象
  private gridContext: CanvasRenderingContext2D = new CanvasRenderingContext2D()
  private barsContext: CanvasRenderingContext2D = new CanvasRenderingContext2D()

  build() {
    Column() {
      Text('柱状图示例')
        .fontSize(18)
        .fontWeight(FontWeight.Bold)
        .margin({ bottom: 10 })

      // 使用Row而不是Stack来更好地控制布局
      Row() {
        // 左侧Y轴标签区域
        Column() {
          // 从上到下的Y轴标签
          ForEach(this.gridValues, (value: number, index: number) => {
            Text(value.toString())
              .fontSize(10)
              .textAlign(TextAlign.End)
              .position({ x: 0, y: (this.chartHeight - 20) - (value / this.maxValue) * (this.chartHeight - 40) })
              .height(20)
          })
        }
        .margin({bottom:'15vp'})
        // .backgroundColor($r('app.color.cs1'))
        .width(20)
        .height(this.chartHeight)

        // 图表区域
        Column() {
          // 图表内容
          Stack() {
            // 背景虚线网格
            Canvas(this.gridContext)
              .width(this.chartWidth)
              .height(this.chartHeight)// .backgroundColor('#f5f5f5')
              .margin({ top: '20vp' })
              .onReady(() => {
                this.drawGrid()
              })

            // 柱状图
            Canvas(this.barsContext)
              .width(this.chartWidth)
              .height(this.chartHeight)
              .margin({ top: '20vp', left: '10vp' })
              .onReady(() => {
                this.drawBars()
              })
          }
          .width(this.chartWidth)
          .height(this.chartHeight)

          // X轴标签
          Row() {
            ForEach(this.data2, (value: string, index: number) => {
              Column() {
                Text(value)
                  .width('40vp')
                  .fontSize(12)
              }
              .margin({ left: 30 })
              // .backgroundColor($r('app.color.cs1'))
              .width(this.barWidth)
            })
          }
          // .justifyContent(FlexAlign.SpaceAround)
          .width(this.chartWidth)
        }

        // .backgroundColor($r('app.color.cs1'))
      }
      .width(this.chartWidth + this.paddings)
      .height(this.chartHeight + 60) // 增加高度以容纳X轴标签

      // 数据更新按钮
      Row() {
        Button('更新数据')
          .onClick(() => {
            this.updateData()
          })
        Button('重置')
          .onClick(() => {
            this.resetData()
          })
          .margin({ left: 10 })
      }
      .margin({ top: 20 })
    }
    .padding(15)
    .backgroundColor(Color.White)
    .borderRadius(10)
    .shadow({ radius: 5, color: Color.Gray, offsetX: 2, offsetY: 2 })
  }

  // 绘制背景虚线网格
  private drawGrid() {
    const actualHeight = this.chartHeight - 20
    // 清除画布
    this.gridContext.clearRect(0, 0, this.chartWidth, this.chartHeight)

    // 绘制虚线
    this.gridContext.lineWidth = 0.5
    this.gridContext.strokeStyle = '#d2dae5'

    this.gridValues.forEach((value) => {
      const y = actualHeight - (value / this.maxValue) * (actualHeight - 20)

      // 设置虚线样式
      // this.gridContext.setLineDash([5, 3])

      this.gridContext.beginPath()
      this.gridContext.moveTo(0, y)
      this.gridContext.lineTo(this.chartWidth, y)
      this.gridContext.stroke()
    })

    // 绘制Y轴
    // this.gridContext.setLineDash([])
    // this.gridContext.strokeStyle = '#333333'
    // this.gridContext.beginPath()
    // this.gridContext.moveTo(30, 10)
    // this.gridContext.lineTo(30, actualHeight)
    // this.gridContext.stroke()
    //
    // // 绘制X轴
    // this.gridContext.beginPath()
    // this.gridContext.moveTo(25, actualHeight)
    // this.gridContext.lineTo(this.chartWidth, actualHeight)
    // this.gridContext.stroke()
  }

  // 绘制柱状图
  private drawBars() {
    const actualHeight = this.chartHeight - 20
    const maxDataValue = Math.max(...this.data, this.maxValue)
    const scale = (actualHeight - 20) / maxDataValue

    // 清除画布
    this.barsContext.clearRect(0, 0, this.chartWidth, this.chartHeight)

    // 绘制每个柱子
    this.data.forEach((value, index) => {
      const x = 20 + index * (this.barWidth + this.barSpacing)
      const barHeight = value * scale
      const y = actualHeight - barHeight

      // 在柱子上方显示数值
      this.barsContext.fillStyle = '#333333'
      this.barsContext.font = '30px sans-serif'
      this.barsContext.textAlign = 'center'
      this.barsContext.fillText(value.toString(), x + this.barWidth / 2, y - 5)


      // 绘制柱子边框
      // this.barsContext.lineWidth = 1
      // this.barsContext.strokeStyle = '#333333'
      // this.barsContext.strokeRect(x, y, this.barWidth, barHeight)

      // 绘制柱子,不带弧度的,如效果图
      this.barsContext.fillStyle = this.colors[index].toString()
      this.barsContext.fillRect(x, y, this.barWidth, barHeight)
 			// 绘制顶部圆角矩形(下面是顶部有弧度的柱子)
       //if (value <= 0) {
       // return
       //}
       //this.drawTopRoundedRect(this.barsContext, x, y, this.barWidth, barHeight, this.cornerRadius)
       // 填充柱子颜色
       //this.barsContext.fillStyle = this.colors[index].toString()
       //this.barsContext.fill()
    })
  }
// 绘制顶部圆角的矩形路径
  private drawTopRoundedRect(ctx: CanvasRenderingContext2D, x: number, y: number, width: number, height: number, radius: number) {
    ctx.beginPath()
    // 从左上角开始
    // 移动到左上角圆角的起点
    ctx.moveTo(x + radius, y)
    // 绘制上边线
    ctx.lineTo(x + width - radius, y)
    // 绘制右上圆角
    ctx.arcTo(x + width, y, x + width, y + radius, radius)
    // 绘制右边线
    ctx.lineTo(x + width, y + height)
    // 绘制下边线(底部不圆角)
    ctx.lineTo(x, y + height)
    // 绘制左边线
    ctx.lineTo(x, y + radius)
    // 绘制左上圆角
    ctx.arcTo(x, y, x + radius, y, radius)
    ctx.closePath()
  }

  // 更新数据
  private updateData() {
    // 生成新的随机数据
    this.data = this.data.map(() => Math.floor(Math.random() * 35))

    // 如果数据超过30,更新最大显示值
    const currentMax = Math.max(...this.data)
    if (currentMax > this.maxValue) {
      this.maxValue = Math.ceil(currentMax / 5) * 5
      this.updateGridValues()
    }

    // 重新绘制
    this.drawBars()
  }

  // 重置数据
  private resetData() {
    this.data = [12, 25, 18, 30]
    this.maxValue = 30
    this.updateGridValues()
    this.drawBars()
  }

  // 更新网格值
  private updateGridValues() {
    // const newGridValues = []
    // const step = 5
    // for (let i = 0; i <= this.maxValue; i += step) {
    //   newGridValues.push(i)
    // }
    // this.gridValues = newGridValues
    // this.drawGrid()
  }
}
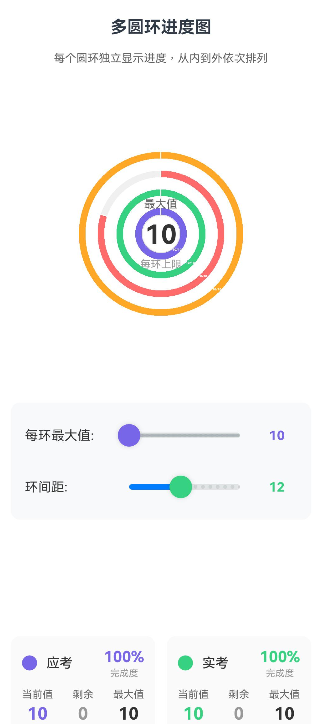
多圆环进度图
- 效果图
@Entry
@Component
struct BarChartPage6 {
  @State private data: number[] = [15, 20, 8, 25] // 实际数据
  @State private labels: string[] = ['应考', '实考', '缺考', '违纪']
  @State private colors: string[] = ['#7766E7', '#36D181', '#FF6B6B', '#FFA726']
  @State private maxValue: number = 30 // 每个环的最大值
  @State private ringSpacing: number = 10 // 环之间的间距

  private chartSize: number = 320
  private ringWidth: number = 8 // 每个环的宽度
  private context: CanvasRenderingContext2D = new CanvasRenderingContext2D()

  build() {
    Column() {
      Text('多圆环进度图')
        .fontSize(18)
        .fontWeight(FontWeight.Bold)
        .margin({ bottom: 15 })

      Text('每个圆环独立显示进度,从内到外依次排列')
        .fontSize(12)
        .fontColor('#666666')
        .margin({ bottom: 20 })

      // 图表区域
      Stack({ alignContent: Alignment.Center }) {
        Canvas(this.context)
          .width(this.chartSize)
          .height(this.chartSize)
          .onReady(() => {
            this.drawMultiRings()
          })

        // 中心信息
        Column({ space: 8 }) {
          Text('最大值')
            .fontSize(12)
            .fontColor('#666666')

          Text(`${this.maxValue}`)
            .fontSize(28)
            .fontWeight(FontWeight.Bold)
            .fontColor('#333333')

          Text('每环上限')
            .fontSize(11)
            .fontColor('#999999')
        }
      }
      .width(this.chartSize)
      .height(this.chartSize)
      .margin({ bottom: 20 })

      // 数据控制面板
      Column({ space: 15 }) {
        // 最大值设置
        Row({ space: 15 }) {
          Text('每环最大值:')
            .fontSize(14)
            .fontColor('#333333')
            .width(80)

          Slider({
            value: this.maxValue,
            min: 10,
            max: 100,
            step: 1,
            style: SliderStyle.OutSet
          })
            .blockColor('#7766E7')
            .showSteps(true)
            .trackThickness(6)
            .layoutWeight(1)
            .onChange((value: number) => {
              this.maxValue = Math.round(value)
              this.drawMultiRings()
            })

          Text(`${this.maxValue}`)
            .fontSize(14)
            .fontWeight(FontWeight.Bold)
            .fontColor('#7766E7')
            .width(30)
        }

        // 间距设置
        Row({ space: 15 }) {
          Text('环间距:')
            .fontSize(14)
            .fontColor('#333333')
            .width(80)

          Slider({
            value: this.ringSpacing,
            min: 5,
            max: 20,
            step: 1,
            style: SliderStyle.OutSet
          })
            .blockColor('#36D181')
            .showSteps(true)
            .trackThickness(6)
            .layoutWeight(1)
            .onChange((value: number) => {
              this.ringSpacing = Math.round(value)
              this.drawMultiRings()
            })

          Text(`${this.ringSpacing}`)
            .fontSize(14)
            .fontWeight(FontWeight.Bold)
            .fontColor('#36D181')
            .width(30)
        }
      }
      .padding(15)
      .backgroundColor('#F8F9FA')
      .borderRadius(10)
      .margin({ bottom: 20 })

      // 数据详情
      Grid() {
        ForEach(this.labels, (label: string, index: number) => {
          GridItem() {
            this.buildRingInfoCard(label, index)
          }
        })
      }
      .columnsTemplate('1fr 1fr')
      .rowsTemplate('1fr 1fr')
      .columnsGap(12)
      .rowsGap(12)
      .width('100%')

      // 操作按钮
      Row({ space: 10 }) {
        Button('随机数据')
          .onClick(() => {
            this.randomData()
          })
          .width('48%')

        Button('重置数据')
          .onClick(() => {
            this.resetData()
          })
          .width('48%')
      }
      .margin({ top: 20 })
    }
    .padding(20)
    .backgroundColor(Color.White)
    .borderRadius(10)
  }

  @Builder
  private buildRingInfoCard(label: string, index: number) {
    // const percentage = Math.round((this.data[index] / this.maxValue) * 100)
    // const remaining = this.maxValue - this.data[index]

    Column({ space: 10 }) {
      // 标题和颜色
      Row({ space: 10 }) {
        Column()
          .width(16)
          .height(16)
          .backgroundColor(this.colors[index])
          .borderRadius(8)

        Text(label)
          .fontSize(14)
          .fontWeight(FontWeight.Medium)
          .fontColor('#333333')
          .layoutWeight(1)

        // 进度百分比
        Column({ space: 2 }) {
          Text(`${Math.round((this.data[index] / this.maxValue) * 100)}%`)
            .fontSize(16)
            .fontWeight(FontWeight.Bold)
            .fontColor(this.colors[index])

          Text('完成度')
            .fontSize(10)
            .fontColor('#999999')
        }
      }

      // 数据详情
      Row({ space: 8 }) {
        Column({ space: 3 }) {
          Text('当前值')
            .fontSize(11)
            .fontColor('#666666')
          Text(`${this.data[index]}`)
            .fontSize(18)
            .fontWeight(FontWeight.Bold)
            .fontColor(this.colors[index])
        }

        Column({ space: 3 }) {
          Text('剩余')
            .fontSize(11)
            .fontColor('#666666')
          Text(`${ this.maxValue - this.data[index]}`)
            .fontSize(18)
            .fontWeight(FontWeight.Bold)
            .fontColor('#999999')
        }

        Column({ space: 3 }) {
          Text('最大值')
            .fontSize(11)
            .fontColor('#666666')
          Text(`${this.maxValue}`)
            .fontSize(18)
            .fontWeight(FontWeight.Bold)
            .fontColor('#333333')
        }
      }
      .justifyContent(FlexAlign.SpaceBetween)
      .width('100%')

      // 手动调整数据
      Row({ space: 5 }) {
        Button('-')
          .width('30%')
          .fontSize(12)
          .onClick(() => {
            this.adjustData(index, -1)
          })

        Slider({
          value: this.data[index],
          min: 0,
          max: this.maxValue,
          step: 1,
          style: SliderStyle.OutSet
        })
          .blockColor(this.colors[index])
          .showSteps(false)
          .trackThickness(4)
          .layoutWeight(1)
          .onChange((value: number) => {
            this.data[index] = Math.round(value)
            this.drawMultiRings()
          })

        Button('+')
          .width('30%')
          .fontSize(12)
          .onClick(() => {
            this.adjustData(index, 1)
          })
      }
      .width('100%')
    }
    .padding(12)
    .backgroundColor('#FAFAFA')
    .borderRadius(10)
    .width('100%')
  }

  // 绘制多圆环
  private drawMultiRings() {
    const centerX = this.chartSize / 2
    const centerY = this.chartSize / 2

    // 清除画布
    this.context.clearRect(0, 0, this.chartSize, this.chartSize)

    // 计算每个环的半径(从内到外)
    // 最内环起始半径 = 中心空心半径
    const innerEmptyRadius = 20
    const ringsCount = this.data.length

    // 绘制每个圆环(从外到内,避免覆盖)
    for (let i = ringsCount - 1; i >= 0; i--) {
      // 计算当前环的内外半径
      const innerRadius = innerEmptyRadius + i * (this.ringWidth + this.ringSpacing)
      const outerRadius = innerRadius + this.ringWidth

      // 绘制灰色背景环(360度)
      this.drawRingSegment(centerX, centerY, innerRadius, outerRadius, 0, 2 * Math.PI, '#F0F0F0')

      // 计算进度角度
      const percentage = this.data[i] / this.maxValue
      const progressAngle = percentage * 2 * Math.PI

      // 绘制进度环(从-90度开始,顺时针)
      if (progressAngle > 0) {
        this.drawRingSegment(
          centerX, centerY,
          innerRadius, outerRadius,
          -Math.PI / 2, -Math.PI / 2 + progressAngle,
          this.colors[i]
        )
      }

      // 添加标签
      this.addRingLabel(centerX, centerY, innerRadius, outerRadius, i)
    }

    // 绘制中心空心圆
    this.context.beginPath()
    this.context.arc(centerX, centerY, innerEmptyRadius, 0, 2 * Math.PI)
    this.context.fillStyle = Color.White.toString()
    this.context.fill()
    this.context.strokeStyle = '#E8E8E8'
    this.context.lineWidth = 1
    this.context.stroke()
  }

  // 绘制圆环段
  private drawRingSegment(
    centerX: number, centerY: number,
    innerRadius: number, outerRadius: number,
    startAngle: number, endAngle: number,
    color: string
  ) {
    this.context.beginPath()

    // 外圆弧
    this.context.arc(centerX, centerY, outerRadius, startAngle, endAngle)

    // 内圆弧(逆时针)
    this.context.arc(centerX, centerY, innerRadius, endAngle, startAngle, true)

    this.context.closePath()
    this.context.fillStyle = color
    this.context.fill()

    // 添加边框效果
    this.context.strokeStyle = Color.White.toString()
    this.context.lineWidth = 1
    this.context.stroke()
  }

  // 添加圆环标签
  private addRingLabel(centerX: number, centerY: number, innerRadius: number, outerRadius: number, index: number) {
    const middleRadius = (innerRadius + outerRadius) / 2
    const angle = Math.PI / 4 // 45度位置

    const labelX = centerX + middleRadius * Math.cos(angle)
    const labelY = centerY + middleRadius * Math.sin(angle)

    // 绘制连接线
    this.context.beginPath()
    this.context.moveTo(centerX + innerRadius * Math.cos(angle), centerY + innerRadius * Math.sin(angle))
    this.context.lineTo(labelX, labelY)
    this.context.strokeStyle = this.colors[index]
    this.context.lineWidth = 1
    this.context.setLineDash([2, 2])
    this.context.stroke()
    this.context.setLineDash([])

    // 绘制标签背景
    const percentage = Math.round((this.data[index] / this.maxValue) * 100)
    const labelText = `${this.labels[index]}\n${this.data[index]}/${this.maxValue}\n${percentage}%`

    this.context.fillStyle = this.colors[index]
    this.context.font = 'bold 10px sans-serif'
    this.context.textAlign = 'center'
    this.context.textBaseline = 'middle'

    // 计算文本尺寸
    const lines = labelText.split('\n')
    const lineHeight = 14
    const padding = 8
    const labelWidth = 60
    const labelHeight = lines.length * lineHeight + padding * 2

    // 绘制圆角矩形背景
    this.context.beginPath()
    // this.context.roundRect(labelX - labelWidth / 2, labelY - labelHeight / 2, labelWidth, labelHeight, 6)
    this.context.fillStyle = this.colors[index]
    this.context.fill()

    // 绘制文本
    this.context.fillStyle = Color.White.toString()
    lines.forEach((line, i) => {
      const y = labelY - labelHeight / 2 + padding + (i + 0.5) * lineHeight
      this.context.fillText(line, labelX, y)
    })
  }

  private randomData() {
    this.data = this.data.map(() => Math.floor(Math.random() * (this.maxValue + 1)))
    this.drawMultiRings()
  }

  private resetData() {
    this.data = [15, 20, 8, 25]
    this.maxValue = 30
    this.ringSpacing = 10
    this.drawMultiRings()
  }

  private adjustData(index: number, delta: number) {
    const newValue = this.data[index] + delta
    this.data[index] = Math.max(0, Math.min(newValue, this.maxValue))
    this.drawMultiRings()
  }
}
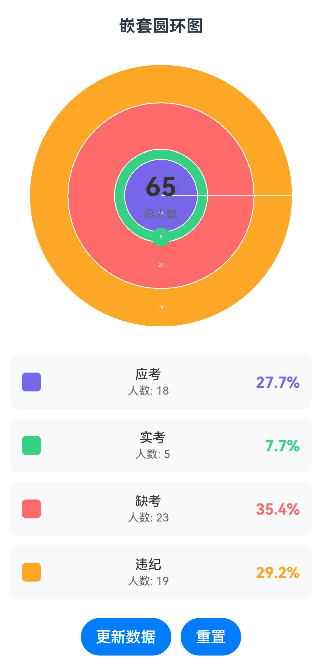
嵌套圆环图
- 效果图
@Entry
@Component
struct BarChartPage5 {
  @State private data: number[] = [32, 28, 2, 3]
  @State private labels: string[] = ['应考', '实考', '缺考', '违纪']
  @State private colors: string[] = [
    '#7766E7', // 最内层 - 应考
    '#36D181', // 第二层 - 实考
    '#FF6B6B', // 第三层 - 缺考
    '#FFA726'  // 最外层 - 违纪
  ]

  private chartSize: number = 300
  private maxRingWidth: number = 40 // 每个圆环的最大宽度
  private context: CanvasRenderingContext2D = new CanvasRenderingContext2D()
  private total: number = 65 // 假设总人数65

  build() {
    Column() {
      Text('嵌套圆环图')
        .fontSize(18)
        .fontWeight(FontWeight.Bold)
        .margin({ bottom: 20 })

      // 图表区域
      Stack({ alignContent: Alignment.Center }) {
        Canvas(this.context)
          .width(this.chartSize)
          .height(this.chartSize)
          .onReady(() => {
            this.drawNestedDonuts()
          })

        // 中心信息
        Column({ space: 5 }) {
          Text(`${this.total}`)
            .fontSize(28)
            .fontWeight(FontWeight.Bold)
            .fontColor('#333333')

          Text('总人数')
            .fontSize(12)
            .fontColor('#666666')
        }
      }
      .width(this.chartSize)
      .height(this.chartSize)
      .margin({ bottom: 20 })

      // 图例和详细信息
      Column({ space: 10 }) {
        ForEach(this.labels, (label: string, index: number) => {
          this.buildLegendItem(label, index)
        })
      }
      .width('100%')

      // 操作按钮
      Row({ space: 10 }) {
        Button('更新数据')
          .onClick(() => {
            this.updateData()
          })
        Button('重置')
          .onClick(() => {
            this.resetData()
          })
      }
      .margin({ top: 20 })
    }
    .padding(20)
    .backgroundColor(Color.White)
    .borderRadius(10)
    .shadow({ radius: 5, color: Color.Gray, offsetX: 2, offsetY: 2 })
  }

  @Builder
  private buildLegendItem(label: string, index: number) {
    Row({ space: 12 }) {
      // 颜色标识
      Column()
        .width(20)
        .height(20)
        .backgroundColor(this.colors[index])
        .borderRadius(4)

      Column({ space: 2 }) {
        Text(label)
          .fontSize(14)
          .fontColor('#333333')
          .fontWeight(FontWeight.Medium)

        Text(`人数: ${this.data[index]}`)
          .fontSize(12)
          .fontColor('#666666')
      }
      .layoutWeight(1)

      // 百分比
      Text(`${((this.data[index] / this.total) * 100).toFixed(1)}%`)
        .fontSize(16)
        .fontWeight(FontWeight.Bold)
        .fontColor(this.colors[index])
    }
    .padding(12)
    .backgroundColor('#F8F9FA')
    .borderRadius(8)
    .width('100%')
  }

  // 绘制嵌套圆环
  private drawNestedDonuts() {
    const centerX = this.chartSize / 2
    const centerY = this.chartSize / 2
    const maxRadius = this.chartSize / 2 - 10

    // 清除画布
    this.context.clearRect(0, 0, this.chartSize, this.chartSize)

    if (this.total === 0) return

    // 计算累积数据(从内到外)
    const accumulatedData: number[] = []
    let sum = 0
    this.data.forEach(value => {
      sum += value
      accumulatedData.push(sum)
    })

    // 绘制每个圆环(从最外层到最内层)
    for (let i = this.data.length - 1; i >= 0; i--) {
      const accumulated = accumulatedData[i]
      const outerRadius = (accumulated / this.total) * maxRadius
      const innerRadius = i > 0
        ? (accumulatedData[i - 1] / this.total) * maxRadius
        : 0

      // 绘制圆环
      this.context.beginPath()
      this.context.arc(centerX, centerY, outerRadius, 0, 2 * Math.PI)
      this.context.arc(centerX, centerY, innerRadius, 2 * Math.PI, 0, true)
      this.context.closePath()

      this.context.fillStyle = this.colors[i]
      this.context.fill()

      // 添加边框
      this.context.strokeStyle = Color.White.toString()
      this.context.lineWidth = 1
      this.context.stroke()
    }

    // 添加标签到每个圆环上
    this.addRingLabels(centerX, centerY, accumulatedData, maxRadius)
  }

  // 添加标签到圆环上
  private addRingLabels(centerX: number, centerY: number, accumulatedData: number[], maxRadius: number) {
    this.context.fillStyle = '#FFFFFF'
    this.context.font = '14px sans-serif'
    this.context.textAlign = 'center'
    this.context.textBaseline = 'middle'

    this.data.forEach((value, index) => {
      const outerRadius = (accumulatedData[index] / this.total) * maxRadius
      const innerRadius = index > 0
        ? (accumulatedData[index - 1] / this.total) * maxRadius
        : 0

      const ringRadius = (outerRadius + innerRadius) / 2
      const angle = Math.PI / 2 // 在右侧中间位置显示

      const labelX = centerX + ringRadius * Math.cos(angle)
      const labelY = centerY + ringRadius * Math.sin(angle)

      // 绘制标签背景
      this.context.beginPath()
      this.context.arc(labelX, labelY, 10, 0, 2 * Math.PI)
      this.context.fillStyle = this.colors[index]
      this.context.fill()

      // 绘制标签文字
      this.context.fillStyle = Color.White.toString()
      this.context.fillText(`${value}`, labelX, labelY)
    })
  }

  private updateData() {
    // 生成新数据,保持总和不变
    const newData: number[] = []
    let remaining = this.total

    for (let i = 0; i < this.data.length - 1; i++) {
      const max = Math.min(remaining - (this.data.length - i - 1), Math.floor(Math.random() * remaining))
      newData.push(max)
      remaining -= max
    }

    newData.push(remaining) // 最后一项取剩余值
    this.data = newData

    this.drawNestedDonuts()
  }

  private resetData() {
    this.data = [32, 28, 2, 3]
    this.drawNestedDonuts()
  }
}

社区规范:仅讨论OpenHarmony相关问题。
更多推荐
 1
1 0
0- 0


 已为社区贡献2条内容

所有评论(0)