智能账户追踪 - OpenHarmony Flutter财务应用
OpenHarmony钱包应用v1.13.0新增高级统计分析功能,提供详细的财务报告。通过AdvancedStats数据模型记录收支总额、分类明细及日均数据,计算支出占比、储蓄率等关键指标。AdvancedStatsService服务支持日期范围统计、支出趋势分析和月度预测。用户可在趋势分析页面查看收支概览、分类分析及预测数据,帮助更全面掌握财务状况。
·
更新概述
v1.13.0 版本为 OpenHarmony 钱包应用增加了强大的高级统计分析功能。用户现在可以通过趋势分析页面的高级统计按钮访问详细的财务分析报告,包括收支概览、分类分析和支出趋势预测。这个新功能帮助用户更深入地了解自己的财务状况。

核心功能更新
1. 高级统计数据模型
AdvancedStats 类定义
/// 高级统计数据模型
class AdvancedStats {
  final double totalIncome;
  final double totalExpense;
  final double balance;
  final double averageDailyExpense;
  final double averageDailyIncome;
  final Map<String, double> categoryExpense;
  final Map<String, double> categoryIncome;
  final List<double> dailyExpenses;
  final List<String> dailyDates;

  AdvancedStats({
    required this.totalIncome,
    required this.totalExpense,
    required this.balance,
    required this.averageDailyExpense,
    required this.averageDailyIncome,
    required this.categoryExpense,
    required this.categoryIncome,
    required this.dailyExpenses,
    required this.dailyDates,
  });

  /// 获取支出占比
  double get expenseRatio => totalIncome > 0 ? totalExpense / totalIncome : 0;

  /// 获取储蓄率
  double get savingsRate => totalIncome > 0 ? balance / totalIncome : 0;

  /// 获取最高支出分类
  String? get topExpenseCategory {
    if (categoryExpense.isEmpty) return null;
    return categoryExpense.entries
        .reduce((a, b) => a.value > b.value ? a : b)
        .key;
  }

  /// 获取最高收入分类
  String? get topIncomeCategory {
    if (categoryIncome.isEmpty) return null;
    return categoryIncome.entries
        .reduce((a, b) => a.value > b.value ? a : b)
        .key;
  }
}
说明:
- 记录收支总额、结余、日均数据
- 记录分类支出和收入
- 提供计算属性:支出占比、储蓄率、最高分类
关键指标说明
| 指标 | 说明 | 计算方式 |
|---|---|---|
| 支出占比 | 支出占收入的比例 | 总支出 / 总收入 |
| 储蓄率 | 结余占收入的比例 | 结余 / 总收入 |
| 日均支出 | 平均每天的支出 | 总支出 / 天数 |
| 日均收入 | 平均每天的收入 | 总收入 / 天数 |
2. 高级统计服务
AdvancedStatsService 类
/// 高级统计服务
class AdvancedStatsService {
  /// 计算高级统计
  static AdvancedStats calculateStats(
    List<wallet.Transaction> transactions,
    DateTime startDate,
    DateTime endDate,
  ) {
    double totalIncome = 0;
    double totalExpense = 0;
    Map<String, double> categoryExpense = {};
    Map<String, double> categoryIncome = {};
    Map<String, double> dailyExpenseMap = {};

    // 过滤日期范围内的交易
    final filteredTransactions = transactions.where((t) {
      return t.date.isAfter(startDate) && t.date.isBefore(endDate.add(const Duration(days: 1)));
    }).toList();

    // 计算统计数据
    for (var transaction in filteredTransactions) {
      if (transaction.type == wallet.TransactionType.income) {
        totalIncome += transaction.amount;
        categoryIncome[transaction.category] =
            (categoryIncome[transaction.category] ?? 0) + transaction.amount;
      } else {
        totalExpense += transaction.amount;
        categoryExpense[transaction.category] =
            (categoryExpense[transaction.category] ?? 0) + transaction.amount;
      }

      // 计算每日支出
      final dateKey = '${transaction.date.month}-${transaction.date.day}';
      if (transaction.type == wallet.TransactionType.expense) {
        dailyExpenseMap[dateKey] = (dailyExpenseMap[dateKey] ?? 0) + transaction.amount;
      }
    }

    final balance = totalIncome - totalExpense;
    final days = endDate.difference(startDate).inDays + 1;
    final averageDailyExpense = days > 0 ? totalExpense / days : 0.0;
    final averageDailyIncome = days > 0 ? totalIncome / days : 0.0;

    // 生成每日数据
    final dailyExpenses = <double>[];
    final dailyDates = <String>[];
    for (int i = 0; i < days; i++) {
      final date = startDate.add(Duration(days: i));
      final dateKey = '${date.month}-${date.day}';
      dailyExpenses.add(dailyExpenseMap[dateKey] ?? 0);
      dailyDates.add('${date.month}/${date.day}');
    }

    return AdvancedStats(
      totalIncome: totalIncome,
      totalExpense: totalExpense,
      balance: balance,
      averageDailyExpense: averageDailyExpense,
      averageDailyIncome: averageDailyIncome,
      categoryExpense: categoryExpense,
      categoryIncome: categoryIncome,
      dailyExpenses: dailyExpenses,
      dailyDates: dailyDates,
    );
  }

  /// 获取支出趋势(增长或下降)
  static String getExpenseTrend(List<double> expenses) {
    if (expenses.length < 2) return '无数据';
    final firstHalf = expenses.take(expenses.length ~/ 2).fold(0.0, (a, b) => a + b);
    final secondHalf = expenses.skip(expenses.length ~/ 2).fold(0.0, (a, b) => a + b);
    if (firstHalf == 0) return '无数据';
    final trend = ((secondHalf - firstHalf) / firstHalf * 100).toStringAsFixed(1);
    return trend;
  }

  /// 获取支出预测
  static double predictNextMonthExpense(List<double> expenses) {
    if (expenses.isEmpty) return 0;
    return expenses.fold(0.0, (a, b) => a + b) / expenses.length * 30;
  }
}
说明:
calculateStats: 计算指定日期范围的统计数据getExpenseTrend: 计算支出趋势(正数表示增长,负数表示下降)predictNextMonthExpense: 预测下个月的支出
3. 高级统计页面
财务概览卡片
/// 构建统计概览
Widget _buildStatsOverview(AdvancedStats stats) {
  return Padding(
    padding: const EdgeInsets.symmetric(horizontal: 16),
    child: Container(
      padding: const EdgeInsets.all(20),
      decoration: BoxDecoration(
        gradient: LinearGradient(
          colors: [Colors.purple.shade400, Colors.purple.shade800],
          begin: Alignment.topLeft,
          end: Alignment.bottomRight,
        ),
        borderRadius: BorderRadius.circular(20),
      ),
      child: Column(
        crossAxisAlignment: CrossAxisAlignment.start,
        children: [
          Text(
            '财务概览',
            style: Theme.of(context).textTheme.titleMedium?.copyWith(
                  color: Colors.white,
                  fontWeight: FontWeight.bold,
                ),
          ),
          const SizedBox(height: 20),
          Row(
            mainAxisAlignment: MainAxisAlignment.spaceBetween,
            children: [
              _buildStatCard('总收入', '¥${stats.totalIncome.toStringAsFixed(2)}', Colors.green),
              _buildStatCard('总支出', '¥${stats.totalExpense.toStringAsFixed(2)}', Colors.red),
              _buildStatCard('结余', '¥${stats.balance.toStringAsFixed(2)}', Colors.blue),
            ],
          ),
          const SizedBox(height: 16),
          Row(
            mainAxisAlignment: MainAxisAlignment.spaceBetween,
            children: [
              _buildStatCard(
                '日均支出',
                '¥${stats.averageDailyExpense.toStringAsFixed(2)}',
                Colors.orange,
              ),
              _buildStatCard(
                '日均收入',
                '¥${stats.averageDailyIncome.toStringAsFixed(2)}',
                Colors.cyan,
              ),
              _buildStatCard(
                '储蓄率',
                '${(stats.savingsRate * 100).toStringAsFixed(1)}%',
                Colors.amber,
              ),
            ],
          ),
        ],
      ),
    ),
  );
}
说明:
- 显示 6 个关键财务指标
- 使用不同颜色区分
- 紫色渐变背景
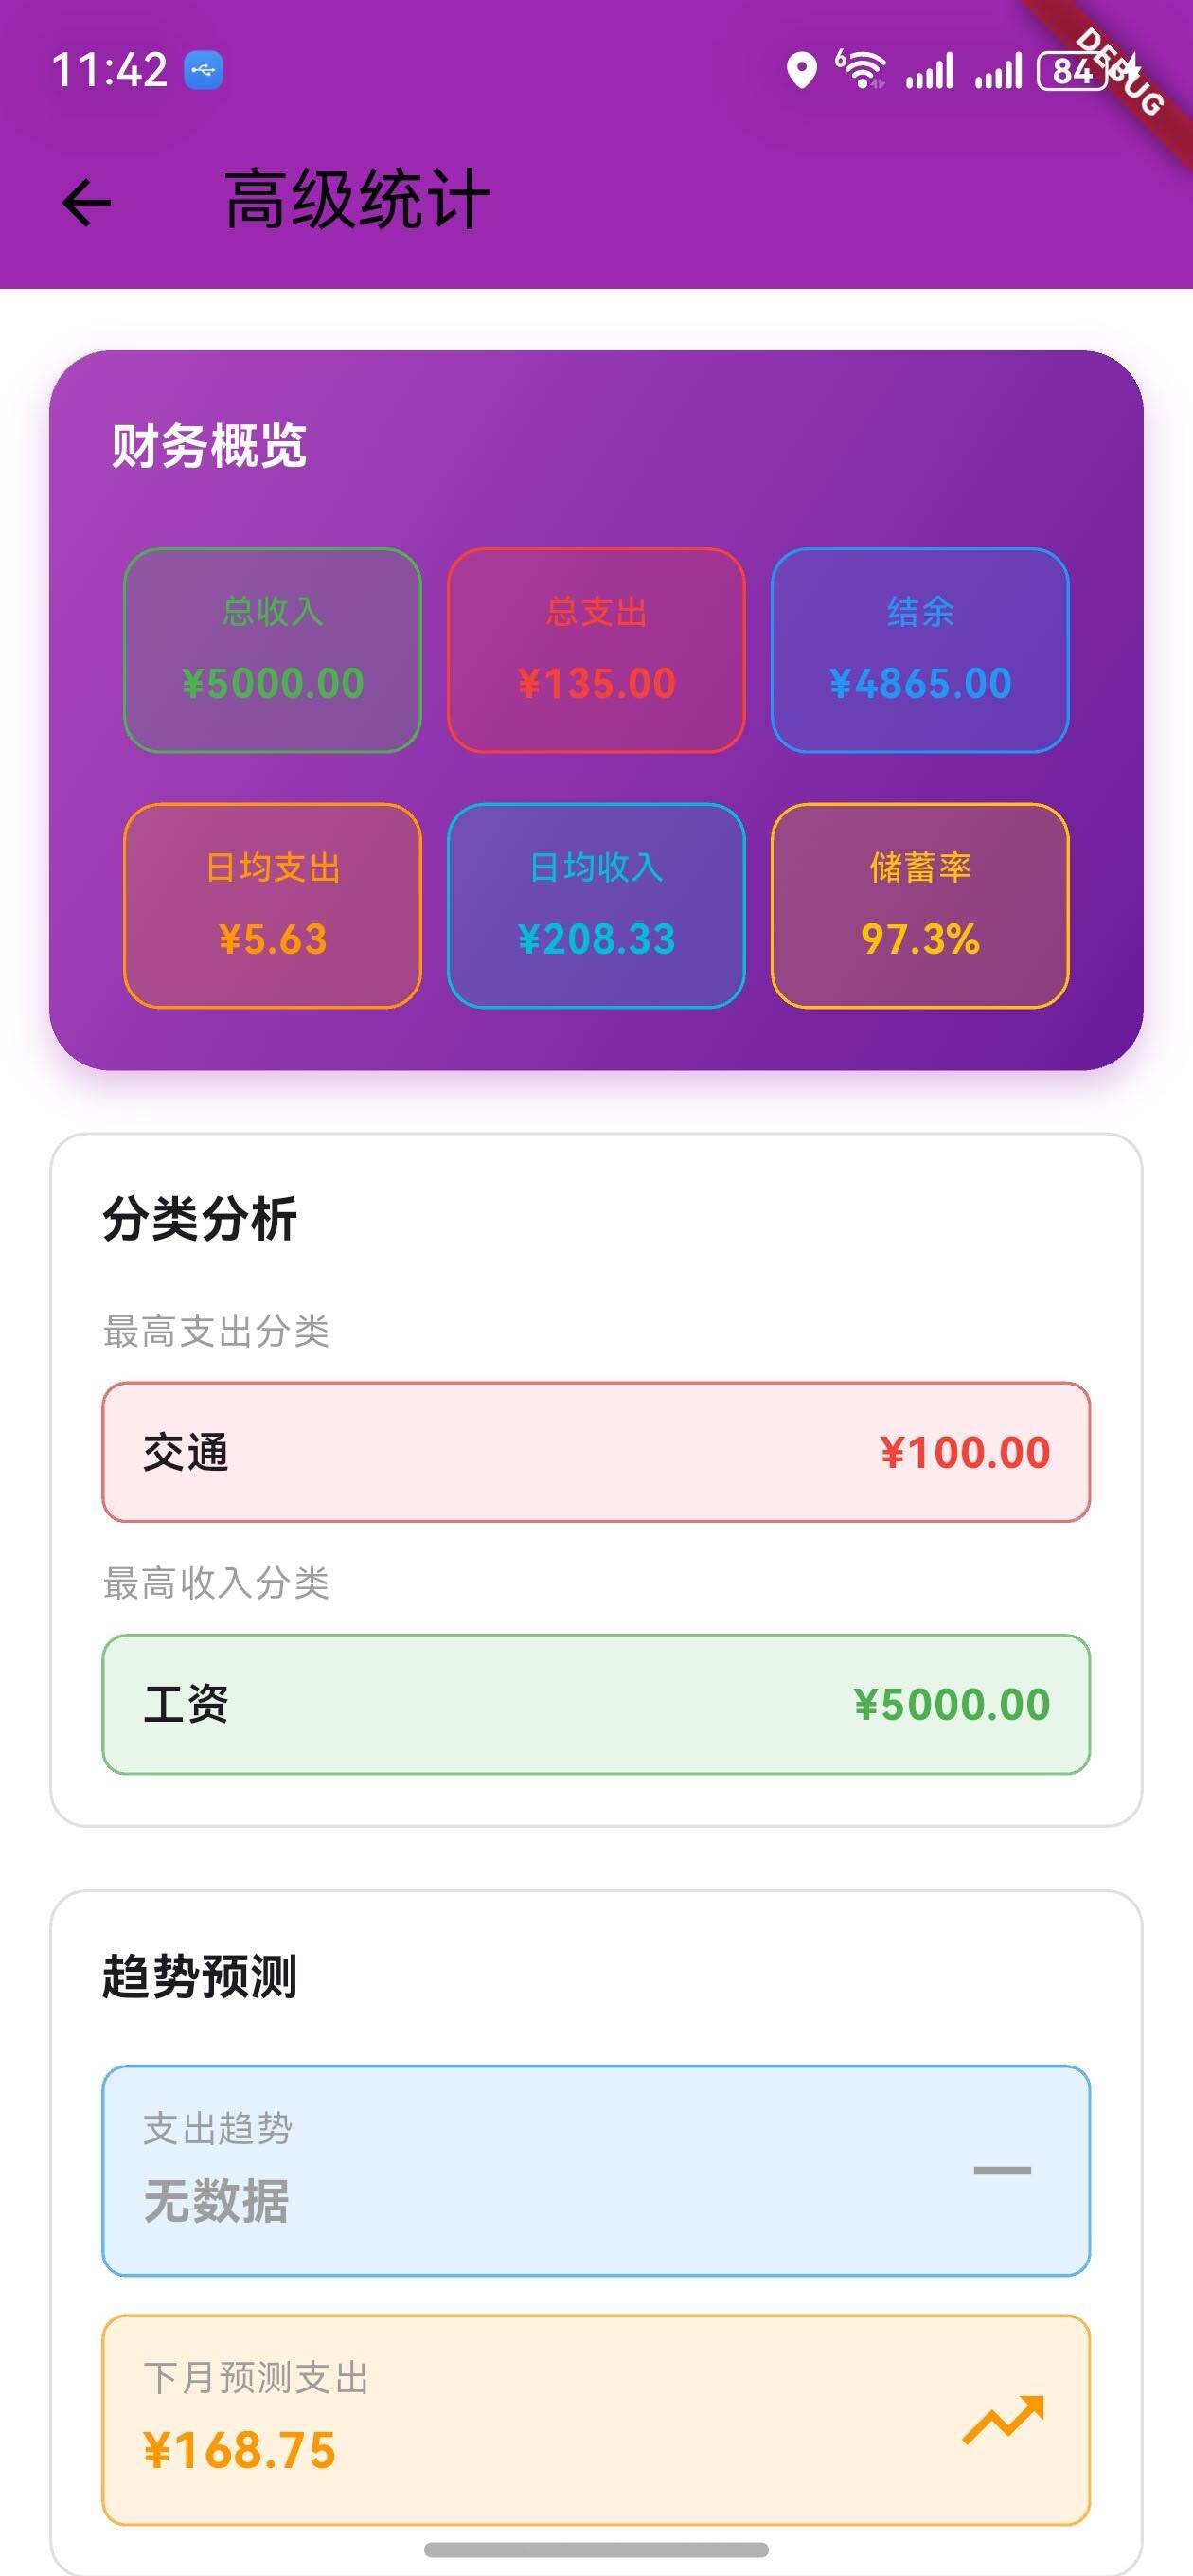
分类分析
/// 构建分类统计
Widget _buildCategoryStats(AdvancedStats stats) {
  return Padding(
    padding: const EdgeInsets.symmetric(horizontal: 16),
    child: Container(
      padding: const EdgeInsets.all(16),
      decoration: BoxDecoration(
        border: Border.all(color: Colors.grey.shade300),
        borderRadius: BorderRadius.circular(12),
      ),
      child: Column(
        crossAxisAlignment: CrossAxisAlignment.start,
        children: [
          Text(
            '分类分析',
            style: Theme.of(context).textTheme.titleMedium?.copyWith(
                  fontWeight: FontWeight.bold,
                ),
          ),
          const SizedBox(height: 16),
          if (stats.topExpenseCategory != null) ...[
            Text('最高支出分类', style: Theme.of(context).textTheme.bodySmall),
            const SizedBox(height: 8),
            Container(
              padding: const EdgeInsets.all(12),
              decoration: BoxDecoration(
                color: Colors.red.shade50,
                borderRadius: BorderRadius.circular(8),
                border: Border.all(color: Colors.red.shade300),
              ),
              child: Row(
                mainAxisAlignment: MainAxisAlignment.spaceBetween,
                children: [
                  Text(stats.topExpenseCategory!),
                  Text(
                    '¥${stats.categoryExpense[stats.topExpenseCategory]!.toStringAsFixed(2)}',
                    style: const TextStyle(color: Colors.red, fontWeight: FontWeight.bold),
                  ),
                ],
              ),
            ),
          ],
        ],
      ),
    ),
  );
}
说明:
- 显示最高支出分类
- 显示最高收入分类
- 使用颜色编码区分
趋势预测
/// 构建趋势分析
Widget _buildTrendAnalysis(AdvancedStats stats) {
  final trend = AdvancedStatsService.getExpenseTrend(stats.dailyExpenses);
  final prediction = AdvancedStatsService.predictNextMonthExpense(stats.dailyExpenses);

  return Padding(
    padding: const EdgeInsets.symmetric(horizontal: 16),
    child: Container(
      padding: const EdgeInsets.all(16),
      decoration: BoxDecoration(
        border: Border.all(color: Colors.grey.shade300),
        borderRadius: BorderRadius.circular(12),
      ),
      child: Column(
        crossAxisAlignment: CrossAxisAlignment.start,
        children: [
          Text(
            '趋势预测',
            style: Theme.of(context).textTheme.titleMedium?.copyWith(
                  fontWeight: FontWeight.bold,
                ),
          ),
          const SizedBox(height: 16),
          Container(
            padding: const EdgeInsets.all(12),
            decoration: BoxDecoration(
              color: Colors.blue.shade50,
              borderRadius: BorderRadius.circular(8),
              border: Border.all(color: Colors.blue.shade300),
            ),
            child: Row(
              mainAxisAlignment: MainAxisAlignment.spaceBetween,
              children: [
                Column(
                  crossAxisAlignment: CrossAxisAlignment.start,
                  children: [
                    Text('支出趋势'),
                    const SizedBox(height: 4),
                    Text(
                      trend == '无数据' ? trend : '$trend%',
                      style: TextStyle(
                        fontWeight: FontWeight.bold,
                        fontSize: 16,
                        color: double.parse(trend) > 0 ? Colors.red : Colors.green,
                      ),
                    ),
                  ],
                ),
                Icon(
                  double.parse(trend) > 0 ? Icons.trending_up : Icons.trending_down,
                  size: 32,
                  color: double.parse(trend) > 0 ? Colors.red : Colors.green,
                ),
              ],
            ),
          ),
          const SizedBox(height: 12),
          Container(
            padding: const EdgeInsets.all(12),
            decoration: BoxDecoration(
              color: Colors.orange.shade50,
              borderRadius: BorderRadius.circular(8),
              border: Border.all(color: Colors.orange.shade300),
            ),
            child: Row(
              mainAxisAlignment: MainAxisAlignment.spaceBetween,
              children: [
                Column(
                  crossAxisAlignment: CrossAxisAlignment.start,
                  children: [
                    Text('下月预测支出'),
                    const SizedBox(height: 4),
                    Text(
                      '¥${prediction.toStringAsFixed(2)}',
                      style: const TextStyle(
                        fontWeight: FontWeight.bold,
                        fontSize: 16,
                        color: Colors.orange,
                      ),
                    ),
                  ],
                ),
                const Icon(Icons.trending_up, size: 32, color: Colors.orange),
              ],
            ),
          ),
        ],
      ),
    ),
  );
}
说明:
- 显示支出趋势(增长或下降百分比)
- 显示下月支出预测
- 使用趋势图标直观表示
UI 变化
高级统计页面布局
┌─────────────────────────────────┐
│  高级统计                        │
├─────────────────────────────────┤
│  财务概览                        │
│  [总收入] [总支出] [结余]        │
│  [日均支出] [日均收入] [储蓄率]  │
├─────────────────────────────────┤
│  分类分析                        │
│  最高支出分类                    │
│  [食物] ¥500                     │
│  最高收入分类                    │
│  [工资] ¥5000                    │
├─────────────────────────────────┤
│  趋势预测                        │
│  支出趋势: +15.5% ↑              │
│  下月预测支出: ¥1500             │
└─────────────────────────────────┘
访问方式
- 进入趋势分析页面
- 点击 AppBar 右侧的分析按钮(📊)
- 进入高级统计页面
版本对比
| 功能 | v1.12.0 | v1.13.0 |
|---|---|---|
| 深色模式 | ✅ | ✅ |
| 主题切换 | ✅ | ✅ |
| 设置页面 | ✅ | ✅ |
| 高级统计模型 | ❌ | ✅ |
| 高级统计服务 | ❌ | ✅ |
| 财务概览 | ❌ | ✅ |
| 分类分析 | ❌ | ✅ |
| 趋势预测 | ❌ | ✅ |
| 支出预测 | ❌ | ✅ |
使用场景
场景 1:查看财务概览
- 进入趋势分析页面
- 点击 AppBar 的分析按钮
- 查看财务概览卡片
- 了解收支和储蓄率
场景 2:分析支出分类
- 进入高级统计页面
- 查看分类分析部分
- 了解最高支出和收入分类
- 调整消费策略
场景 3:预测下月支出
- 进入高级统计页面
- 查看趋势预测部分
- 了解支出趋势
- 查看下月预测支出
- 提前做好预算规划
技术亮点
1. 灵活的日期范围
- 支持任意日期范围的统计
- 自动计算每日数据
- 支持跨月统计
2. 智能趋势分析
- 将时间段分为两半
- 比较前后两个时间段的支出
- 计算增长或下降百分比
3. 支出预测算法
- 计算平均每日支出
- 乘以 30 得到月度预测
- 简单有效的预测方法
4. 分类统计
- 自动统计各分类支出
- 快速找到最高分类
- 支持多分类对比
感谢使用 OpenHarmony 钱包! 🎉
如有建议或问题,欢迎反馈。
欢迎加入开源鸿蒙跨平台社区:https://openharmonycrossplatform.csdn.net

社区规范:仅讨论OpenHarmony相关问题。
更多推荐
 9
9 0
0- 0


 已为社区贡献10条内容

所有评论(0)